
Imagine this: A friend comes to you, hat in hand, asking for a $500,000 loan, payable over 30 years. This friend makes about $70,000 a year and has no big raises on the horizon. But here’s the kicker—they also want to borrow an extra $30,000 annually on top of that half-million. Would you take that deal? Probably not, unless you’re a glutton for financial punishment.
Here’s the twist: This is basically the U.S. government’s current arrangement with its creditors. With a staggering $35 trillion in national debt, $5 trillion in annual revenue, and an ever-growing $2 trillion annual budget deficit, the government keeps borrowing to fuel its insatiable spending. Yet, Treasury rates on 10- and 30-year bonds—our main tools to fund all this—are still below 4.5%. Does anyone else see a problem with this picture?
Debt Reality Check
The U.S. national debt hit a staggering milestone this year: $35 trillion—the highest it’s ever been. That’s over $106,000 per person or a jaw-dropping $277,000 per household. Just for perspective, back in the early ’80s, the national debt was about $907 billion. So, yes, things have...escalated.
The chart below shows how the debt has steadily climbed from 2000 to 2024, doubling in just the last eight years to break past $35 trillion. This steep rise underscores the challenges policymakers face and the urgent need for fiscal discipline.

Who holds all this debt? The Federal Reserve and other intragovernmental funds (like Social Security) are the largest single holders, with around 21%, or $7.37 trillion. Much of this was amassed during the pandemic when the Fed bought up Treasuries in record amounts to keep the economy afloat through shutdowns and quarantines.
The other $28.45 trillion? The public owns that. Here’s a rough breakdown of who’s holding onto those IOUs: the Fed and government entities (35%), foreign and international investors (24%), other investors (16%), mutual funds (10%), state and local governments (5%), depository institutions (5%), private pension funds (2%), insurance companies (1.5%), and other pension funds (1.5%).
Borrowing Tools
The U.S. funds its debt using three main instruments:
Treasury Bills (T-Bills) – Yield: 4.58% on a 3-month term
Short-term securities with maturities from 4 to 52 weeks. Auctions for 4- and 13-week bills happen weekly, while 26- and 52-week bills are auctioned monthly.
Treasury Notes (T-Notes) – Yield: 4.26% on a 10-year term
Medium-term securities maturing between 2 and 10 years. Auctions are held monthly for notes of 2, 3, 5, and 7 years and quarterly for 10-year notes.
Treasury Bonds – Yield: 4.48% on a 30-year term
Long-term securities with 20- or 30-year maturities are auctioned quarterly.
T-notes and Treasury Bonds comprise the majority of U.S. debt, with T-bills serving as a smaller but essential piece for short-term funding. The 10-year yield stayed under 2% for 2020 – 2022, while the blended average rate across all debt is about 3.32%. I realize the U.S. dollar is the primary currency reserve in the world, but these rates are shockingly low relative to the underlying risk.
Fiscal Excess: A Bipartisan Legacy
Blaming one political party for the debt crisis is lazy and misguided. Every administration—regardless of political affiliation—has contributed to this problem. From Bush’s wars and Obama’s healthcare expansion to Trump’s tax cuts and Biden’s spending bills, this has been a bipartisan effort in fiscal irresponsibility. And the problem is accelerating. Our national debt has doubled over the last 8 years. Under President Trump’s four years in office, our national debt increased by $7.2 trillion. Biden/Harris debt is currently around $6.3 trillion (and growing).
Below is a list of the various bills that added mind-boggling debt to our balance sheet:
Tax Cuts and Jobs Act – “Trump Tax Cuts” (2017): $1.9 trillion over a decade (This bill lowered corporate and individual tax rates, reducing federal revenue while increasing economic output modestly.)
Coronavirus Aid, Relief, and Economic Security – “C.A.R.E.S.” (2020): $2.2 trillion. (Passed during the early months of the pandemic, the CARES Act provided direct stimulus payments to individuals, expanded unemployment benefits, and offered financial support to businesses through programs like the Paycheck Protection Program (PPP). It also provided healthcare systems and state governments funding to respond to the public health crisis.)
Bipartisan Budget Acts (2018 and 2019): $2.1 trillion (These acts raised caps on defense and non-defense discretionary spending, effectively dismantling prior fiscal restraints from the 2011 Budget Control Act.
The American Rescue Plan (2021): $1.9 trillion. (This COVID-19 relief package aimed to stimulate the economy through direct payments, extended unemployment benefits, and funds for state and local governments.)
Infrastructure Investment and Jobs Act (2021): $1.2 trillion. (Also known as the Bipartisan Infrastructure Law, it allocated funds for roads, bridges, broadband, and clean water, among other infrastructure improvements.)
Inflation Reduction Act (2022): $485 billion. (Although framed as a deficit-reducing bill, it primarily targeted healthcare subsidies, climate initiatives, and tax reforms.)
CHIPS and Science Act (2022): $280 billion. (This bill focuses on boosting semiconductor production and scientific research to enhance national security and technological competitiveness.)
Student Loan Forgiveness and Other Executive Actions (2023 – 2024): $1.25 trillion. (This bill focused on student debt, especially Pell Grant recipients, eligible for up to $20,000 in loan forgiveness.)
Where the Money Goes
The U.S. last balanced its budget in 2001 under President Clinton. The only other time in the last half-century was under President Johnson in 1969. So, in 50 years, we’ve had just two budget surpluses!
For FY24, here’s how the math breaks down: the government plans to bring in $4.9 trillion in taxes but spend a whopping $6.75 trillion, leaving a $1.9 trillion budget deficit. Here’s where the money is going:
· Social Security – 22% / $1.46 trillion
· Health – 14% / $912 billion
· Net Interest on Debt – 13% / $882 billion
· Medicare – 13% / $874 billion
· National Defense – 13% / $874 billion
· Income Security – 10% / $671 billion
· Veterans Benefits and Services – 5% / $325 billion
· Education, Training, Employment, and Social Services – 5% / $305 billion
· Transportation – 2% / $137 billion
· Community and Regional Development – 1% / $88 billion
· Other – 3% / $223 billion
Unfortunately, there’s no clear end to this spending spree. Projections show persistent budget deficits as a percentage of GDP over the coming decades, hovering between 7% and 8%. Without bold changes, debt levels could reach unsustainable highs, risking economic instability.

Debt as a percentage of GDP is over 120%, landing the U.S. among the top 10 most indebted nations, just behind countries like Venezuela, Greece, and Italy. The debt-to-GDP ratio increased significantly during President Trump’s term (up 23 percentage points), primarily due to the pandemic’s economic hit and subsequent GDP drop. While the ratio has stayed relatively steady under President Biden, inflation-driven GDP growth has kept it from climbing further. However, as debt grows, we edge closer to the limits of sustainability.
Solutions: The Painful Path Forward
This is a complicated problem with painful solutions. There is no magic bullet to get our fiscal house in order. Here are some realistic (and probably unpopular) moves that could get us back on track.
1. Cut Spending
Cutting spending must be the first step if we’re serious about reducing the deficit. Voters are understandably wary of paying more taxes when they feel their money isn’t spent wisely. The government must show restraint and a commitment to efficiency before higher taxes can gain public support.
Most of the budget goes to mandatory programs like Social Security, Medicare, and Medicaid, which account for two-thirds of federal spending. These programs are costly, especially given the aging population and rising healthcare costs. Interest on our debt is another big bite, with interest payments forecasted to reach $1.7 trillion by 2035.
That leaves us with discretionary spending, and here’s the kicker: defense spending alone accounts for about half of this amount. The rest covers various programs, from education and veterans' benefits to transportation and social services (see chart below).

What Needs to Happen:
Reform Entitlement Programs: Tackle rising costs by adjusting Social Security (raising the retirement age, for example) and limiting Medicare benefits for high earners.
Targeted Spending Cuts: Seek bipartisan support to trim wasteful discretionary programs.
Austerity Measures: Like other countries with debt crises, the U.S. might need stricter spending caps tied to debt-to-GDP ratios.
Limit Foreign Aid and Reduce Defense Spending: While noble, we’re spending billions on aid that might be unsustainable.
No New Spending: If it’s not essential, let’s press pause—no blank checks.
2. Raise Taxes (Brace Yourself)
The tax debate often centers on fairness, but here’s a fact check: the top 1% of income earners already pay most of the federal income tax (46% of income tax collected), with the top 50% paying nearly all of it (97.7%). Our tax system is progressive—higher earners pay higher rates—but some taxes, like payroll taxes, are regressive and hit low-income earners harder.
Here are a few ideas for raising revenue without shocking the entire system:
What Needs to Happen:
Expire the Trump Tax Cuts: This won’t be popular, but expiring these cuts could generate $390 billion.
Raise the Corporate Tax Rate: In his first term, Trump cut the corporate rate from 35% to 21% (and has proposed lowering it to 15% if elected); a bump to 25% would raise $75 billion.
Increase Payroll Taxes: A 1% increase applied across all wages could bring in $260 billion.
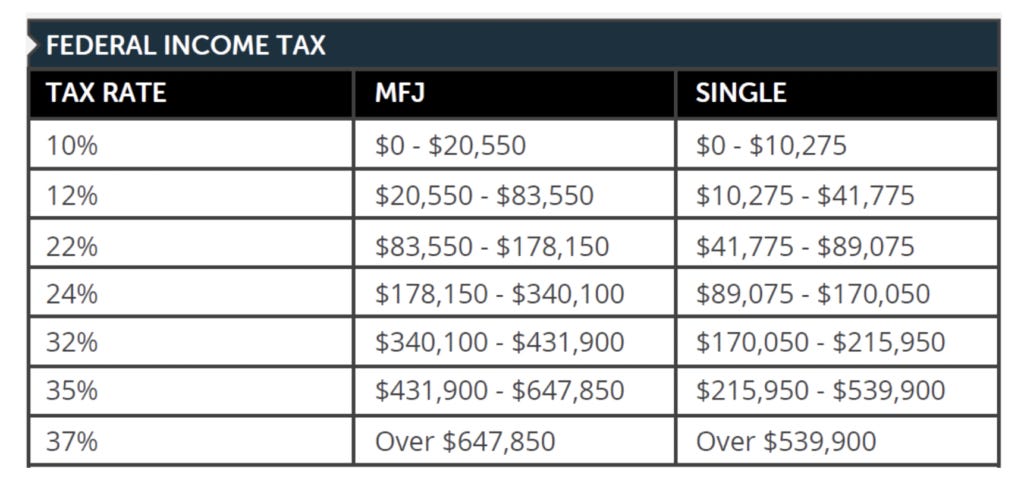
Adjust Individual Rates for High Earners: A modest 10% increase on the top four income tiers (everyone making over $200,000) could generate $300 billion.
3. Grow the Economy (the Long Game)
Growth is the best way to lower the debt burden without drastic cuts. However, recent GDP growth hasn’t been fast enough to counter rising deficits, especially given stagnant productivity and workforce limitations. Expanding the labor force and investing in tech could provide a much-needed boost.
What Needs to Happen:
Increase Workforce Participation: Policies promoting legal immigration that expand the labor force could help offset the void left by retiring Boomers.
Foster Innovation: Investments in tech, AI, clean energy, and infrastructure can drive productivity.
Encourage Business Growth: Extending tax incentives for startups and supporting small businesses will spur job creation and wage growth.
Interest Rates and Inflation
Given the state of our financial house, interest rates are absurdly low. Eventually, buyers of our bonds will come to the same conclusion. As debt and deficits rise and U.S. credit quality weakens, U.S. debt buyers will demand a higher rate or go elsewhere. China is already dumping U.S. Treasuries and diversifying its reserves in gold. Legendary investor Stanley Druckenmiller has a short position on US bonds, accounting for around 20% of his portfolio. If global buyers hesitate, the Fed may need to buy a more significant percentage of our bonds, which would further fuel higher interest rates.
All of these scenarios lead to higher inflation, which could be a helpful tool in tackling our debt. When inflation rises, the real value of existing debt decreases as the currency loses purchasing power, making it easier for the government to service its debt. However, inflation is a regressive tax that hits lower-income earners hardest, and untamed can have devastating consequences.
I am not a financial advisor, and this is not financial advice. However, if the inflation forecast proves accurate, avoiding bond funds and putting some of your investments in inflation-hedge positions would be prudent. Traditionally, this means assets such as gold, Bitcoin, commodities, real estate (multi-family), and specific equities with pricing power.
Politics: A Debt-Defying Act
Let me start by saying I’m independent and not registered with any political party. I’ve voted on both sides of the aisle for 25 years. I’m not endorsing any candidate here, but we can’t ignore the fact that politics plays a big role in the debt conversation.
As the presidential election approaches, we hear ambitious proposals from both candidates—without much talk about the national debt. Kamala Harris is pitching plans to expand the Child Tax Credit, offer new small business deductions, and extend ACA subsidies. Meanwhile, Donald Trump wants to extend his 2017 tax cuts, eliminate Social Security taxes, and cut the corporate tax rate to 15%.
The Penn Wharton Budget Model estimates that Trump’s proposals could add $5.8 trillion to the deficit over the next decade, while Harris’s plans might increase it by over $2 trillion. With deficits already at 7–8% of GDP and a debt-to-GDP ratio on track to exceed 130%, it’s clear the debt problem isn’t on the campaign radar. Yet here we are, with two candidates dodging the elephant (or donkey) in the room.
Here’s a side-by-side view of the candidates’ economic proposals and their likely impact on the budget:

Neither of these platforms addresses the debt crisis in a meaningful way. Instead, they’re both in the business of promising without accounting for the bill. It’s hard to tell if they’re playing a game of fiscal “chicken” with the debt ceiling, but one thing’s for sure: regardless of who wins, the national debt isn’t going to solve itself.

The Bottom Line
The U.S. can’t keep running up a tab that no one wants to pay. We’ve stretched our spending habits to the limit, and while the debt may not seem pressing in the election cycle, it’s only a matter of time before it becomes impossible to ignore. At some point, the binge spending, borrowing, and avoiding tough choices will catch up with us—and when it does, we’ll all feel it.
This isn’t about who’s in office; it’s about taking responsibility and planning for the future. We’ve got to choose between continuing the cycle of “take the money and run” or finally tackling the reality of our national debt. Only with a balanced approach—spending cuts, thoughtful tax policies, economic growth, and, yes, a little austerity—do we stand a chance to sidestep a financial crisis.
Name That Tune!
While wrapping up this newsletter, I’m listening to “Take the Money and Run” by the Steve Miller Band. It's the perfect tune for reflecting on debt, deficits, and fiscal irresponsibility. After all, it’s a catchy anthem about two outlaws, Billy Joe and Bobbie Sue, who skip town with a fortune and leave the authorities scratching their heads. A fitting metaphor for modern government spending, right?
The Steve Miller Band formed in San Francisco in 1966, blending rock, blues, and psychedelic sounds to create a unique style. Steve Miller himself was born into a musical family in Milwaukee, where blues legends like Les Paul and T-Bone Walker were frequent visitors to his childhood home. After moving to Texas, Miller developed his love for rhythm and blues before finding fame in the West Coast rock scene.
The band hit its stride in the 1970s, producing a string of chart-topping hits. “Take the Money and Run,” released in 1976, became one of their most enduring songs, peaking at No. 11 on the Billboard Hot 100. It’s an energetic tale of two lovers-turned-criminals who escape with stolen cash, leaving the Texas police “hot on their heels.”
Beyond the catchy rhythm and sing-along chorus, the song reflects themes of freedom, rebellion, and the allure of easy money—perfect parallels to today’s economic landscape, where politicians seem all too comfortable spending with abandon.
Whether you’re analyzing government debt or just cruising down the highway with the windows down, “Take the Money and Run” is a timeless classic. Give it a listen, and see if it doesn’t get stuck in your head. (And if you find yourself humming along, don't worry—I won’t judge.)
References
The following information sources were referenced when creating this blog post.
University of Pennsylvania Wharton School of Business - Budget Model
https://budgetmodel.wharton.upenn.edu/issues/2024/8/26/trump-campaign-policy-proposals-2024
Pew Research Center - Who Owns the U.S. Debt?
Statista - Holders of U.S. Debt
https://www.statista.com/statistics/201881/holders-of-the-us-public-debt/
U.S. Treasury Website - What is the National Debt?
https://fiscaldata.treasury.gov/americas-finance-guide/national-debt/#breaking-down-the-debt
Bloomberg - Treasury yields
https://www.bloomberg.com/markets/rates-bonds/government-bonds/us
Investopedia - Treasury Bills vs Treasury Notes vs Treasury Bonds
Pew Research Center - Five Facts about the U.S. Debt
U.S. Treasury Website - Debt to the Penny
https://fiscaldata.treasury.gov/datasets/debt-to-the-penny/debt-to-the-penny
Congressional Budget Office - Distribution of Federal Taxes
https://www.cbo.gov/topics/taxes/distribution-federal-taxes
IRS - Understanding Taxes
Tax Foundation - Federal Income Tax Data
https://taxfoundation.org/data/all/federal/latest-federal-income-tax-data-2024/
Committee for a Responsible Federal Budget
PBS - Nonpartisan Analysis of National Debt under Harris and Trump
Investopedia - U.S. Debt by President
https://www.investopedia.com/us-debt-by-president-dollar-and-percentage-7371225
Committee for a Responsible Federal Budget - Trump and Biden Debt Growth
https://www.crfb.org/blogs/trump-and-biden-debt-growth
Committee for a Responsible Federal Budget - The Impact of Trump and Harris Plans on Revenue and Spending
https://www.crfb.org/blogs/impact-trump-and-harris-plans-spending-and-revenue
The American Presidency Project - The Inflation Reduction Act
Tax Foundation - CHIPS Act
https://taxfoundation.org/wp-content/uploads/2024/03/FF830.pdf
Tax Foundation - Federal Tax Policies
https://taxfoundation.org/testimony/tax-cuts-and-jobs-act-biden-tax-policies/
University of Pennsylvania Wharton - Student Loan Forgiveness Model
https://budgetmodel.wharton.upenn.edu/issues/2024/4/11/biden-student-loan-debt-relief
Committee for a Responsible Federal Budget - CARES Act
https://www.crfb.org/blogs/how-much-would-fiscal-responsibility-act-save
University of Pennsylvania Wharton School of Business - Inflation Reduction Act
https://budgetmodel.wharton.upenn.edu/issues/2022/7/29/inflation-reduction-act-preliminary-estimates
Department of Treasury – Fiscal Data
https://fiscaldata.treasury.gov/americas-finance-guide/national-deficit/
Department of Treasury – U.S. Government Spending
https://fiscaldata.treasury.gov/americas-finance-guide/federal-spending/
Brookings – Discretionary Spending in the Federal Budget
https://www.brookings.edu/articles/what-is-discretionary-spending-in-the-federal-budget/
GAO – Entitlement Programs
https://www.gao.gov/products/122637
Peter Peterson Foundation – Forecast for Interest Payments on the U.S. Debt
World Population Review – Debt to GDP rankings by country
https://worldpopulationreview.com/country-rankings/debt-to-gdp-ratio-by-country
Statista – 10-year Treasury Yield by Year
Federal Reserve Bank of St. Louis – Debt as a Percentage of GDP
https://fred.stlouisfed.org/series/GFDEGDQ188S
International Banker – What’s Behind China’s Gold-Buying Spree?
Scott: REALLY well done. Your best piece yet. Keep them coming. I completely agree with your perspective here and am saddened that this isn't our national dialogue right now. May we all read and ask more of everyone running going forward. We can change things if we all demand more vs just trying to argue with someone that feels different on personal choices.